
Bitcoin Support Levels Analysis
Explore Bitcoin support levels, 20-week moving average, and market sentiment to understand price action and trading risks in November 2026.
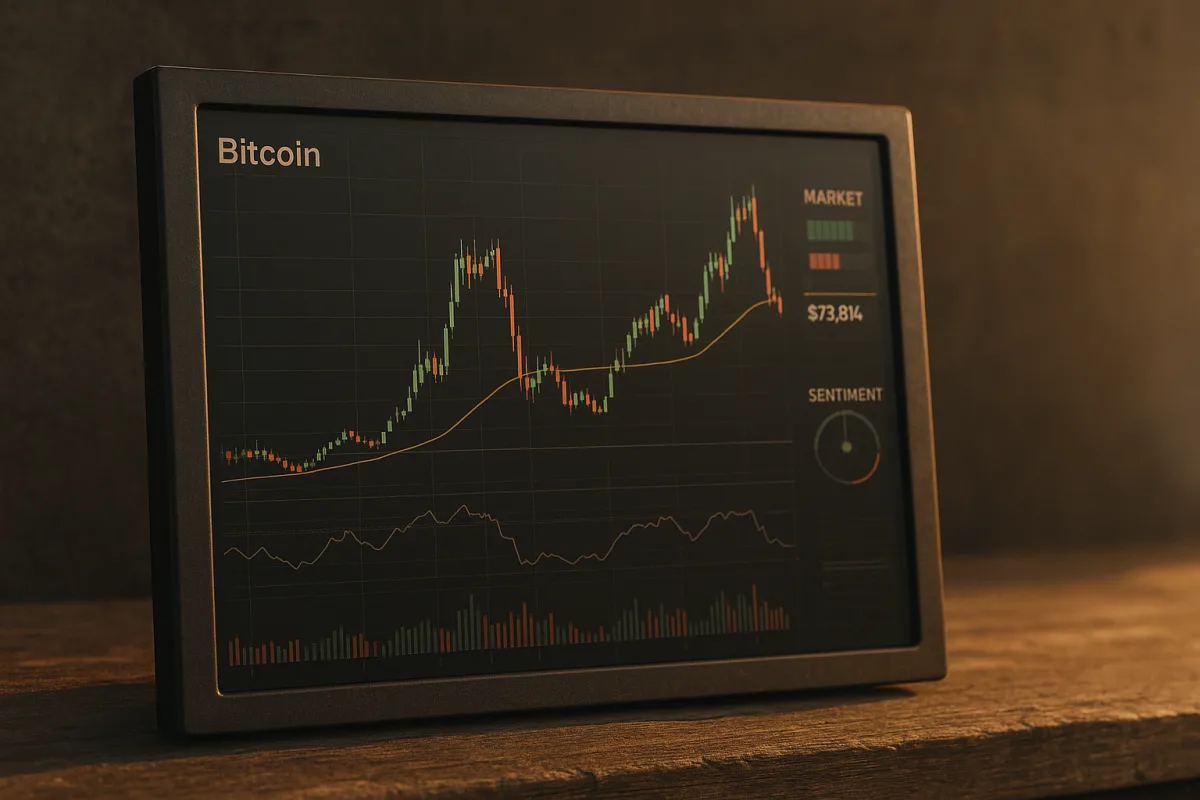
Put the current price on a weekly chart
Bitcoin around $73,814 puts the chart close to levels traders are using to define either a correction or a deeper breakdown. The price had fallen to a six-week low of $76,275 on November 5, amid heavy volatility following the Binance security incident. [10]
The immediate risk is that technical support can fail while derivatives liquidations and macro pressure accelerate the decline. More than $6.22 billion of crypto positions were liquidated in early November, with 68.7% of that total coming from longs. [11]
Start with weekly candles, not intraday moves. A weekly chart filters the sharp reversals that can make a one-hour bounce look like a trend reversal, then disappear after the U.S. equity market opens.
Crypto Banter described five consecutive red weeks and a fight around $75,000, framing the market as a narrow contest between support and renewed selling. Its view was conditional, not a declaration that the low had arrived.
Check how the support band was calculated
The bull market support band commonly combines a 20-week simple moving average and a 21-week exponential moving average. The 20-week SMA is based on 140 days of closing prices, so different data feeds and cutoff times can produce different readings.
CryptoKeyhole placed Bitcoin’s 20-week SMA at $73,331 on November 9. Maketo placed the same indicator at $78,996 on November 8, a wide enough gap to change whether a quoted price appears above or below support. [1][2]
Benjamin Cowen, the analyst behind Into The Cryptoverse, identified roughly $73,500 as the area where Bitcoin had reached the 20-week average. He expected the market to lose the support band, citing a historically weak fourth-quarter window and pressure from equities.
Do not record “the” 20-week average without a date, provider, and closing convention. We would skip any trade plan built around a level that cannot be reproduced on the charting platform you actually use.
Separate a tag of support from a reclaim
A wick into a moving average says price reached a level where buyers appeared. A reclaim requires more, typically a close above the level followed by price holding it through subsequent sessions.
Crypto Banter called $81,200, rounded to $82,000, the level bulls needed to regain to show they had recovered control. Its analysts also said Bitcoin holding above $70,000 into month-end while equities remained weak would improve the longer-term chart picture.
Those are technical scenarios, not forecasts. Price can bounce from a support zone, then fail below it, particularly when the trend still produces lower highs and lower lows.
Write down two separate observations: where the first buyer response occurred, and where the market would need to close to reverse the prior breakdown. Combining those events is how a short-covering rally gets mistaken for a new uptrend.
Take a sentiment reading without treating it as a signal
The Bitcoin Fear and Greed Index stood at 32, classified as Fear, on November 10, after reading 29 the day before. It ranged from 25 to 36 over the preceding week, with an average of 32. [3]
Fear can help explain why investors are reluctant to add risk, but it cannot identify the next price direction. The index was also moving during a large exchange theft, liquidation wave, inflation concerns, and uncertainty around rates.
Crypto Banter presented low sentiment as a condition in which dollar-cost averaging may appeal to some market participants. The channel also warned that attempts to catch a falling market without risk controls can leave traders exposed if the bounce fails.
We would use sentiment as a temperature check. When the index is fearful, demand stronger confirmation from price and market structure, because fear can persist through several more weekly declines.
Inspect leverage before calling capitulation
Perpetual futures funding rates show whether leveraged traders are paying to hold long or short positions. Negative funding often means shorts are paying longs, a reversal of crypto’s more typical long-heavy positioning.
Vetle Lunde, head of research at Norwegian crypto brokerage K33, told Lark Davis that the market had recorded its longest negative 30-day average funding streak of the decade. He interpreted it as an unusually concentrated bearish bias and weak leverage appetite.
Lunde said similar conditions have appeared near periods of peak selling pressure or seller exhaustion. His conclusion was that the market resembled the quieter stretches of 2023, when long-term investors could accumulate before later volatility returned.
That remains an analyst interpretation. Negative funding can fuel a short squeeze, but it can also reflect traders correctly positioning for more downside, so monitor whether spot buying accompanies any derivatives-driven rally.
Track ETF outflows and liquidation pressure
U.S. spot Bitcoin ETFs recorded approximately $643 million in net outflows on October 30, their largest single-day withdrawal since June. That points to real sell-side pressure outside the perpetual-futures market. [11]
ETF outflows do not reveal whether every seller is bearish on Bitcoin’s long-term prospects. They do show that a major route for institutional and brokerage-account exposure was seeing net withdrawals during the broader risk-off period.
Gate Research linked the market’s turbulence to capital outflows and broad liquidations across global risk assets. Its framing fits the recent sensitivity between Bitcoin, technology stocks, the dollar, and interest-rate expectations. [8]
Put ETF flows, futures open interest, funding, and liquidation data in the same log. A bottoming case becomes stronger when forced selling fades and spot demand absorbs supply, not when only futures positioning reverses.
Watch macro events alongside Bitcoin levels
Bitcoin has traded closely with the Nasdaq during the recent technology selloff, according to Crypto Casey. That relationship leaves crypto exposed if inflation or rate expectations raise Treasury yields and reduce appetite for risk assets.
Inflation readings above expectations have increased concern about further Federal Reserve rate hikes, a headwind for speculative assets. Analysts have not published a model that assigns a fixed Bitcoin price move to any one inflation or Fed outcome. [11]
Crypto Casey cited a December 9 Federal Open Market Committee meeting and Polymarket odds then showing a 78% probability of a 25-basis-point hike. Those odds can change quickly, so record the timestamp before using prediction-market probabilities.
Benjamin Cowen’s bearish case also depended on the Nasdaq correction extending. If you follow this framework, compare Bitcoin’s weekly close with technology indexes, the dollar index, and yields, instead of reading the Bitcoin chart in isolation.
Treat the Binance breach as a financial risk, not background noise
The October 29 Binance theft brought custody risk back into the market’s price action. MoneyWeek described it as a $6.3 billion heist, while Tom’s Hardware reported a $5.6 billion suspected North Korea-linked theft, showing that early loss estimates differed. [4][5]
Reporting cited in the market briefing put the amount at $6.34 billion, with $2.85 billion in stolen assets frozen and Binance covering losses through its SAFU reserve. The varying totals are a reason to wait for confirmed accounting before relying on headline figures.
K33’s Lunde said 18,000 BTC were stolen, compared with more than 100,000 BTC in the 2016 Bitfinex hack. He argued that the smaller Bitcoin quantity, asset freezes, and Binance’s capacity to compensate customers helped limit panic.
The market’s resilience does not remove operational risk for account holders. Review which assets need immediate liquidity, which custody provider controls the keys, and whether a single compromised login or device could expose your full balance.
Keep politics out of the price target
The November 3 midterm elections gave Democrats control of Congress, creating uncertainty around market-structure legislation. The Senate had already blocked the Digital Asset Market Clarity Act on September 15 by a 49-50 vote amid concerns about President Trump’s crypto investments. [6]
Crypto Casey argued that divided government could produce gridlock and limit immediate anti-crypto action. That is a political thesis, while current reporting indicates no finalized new framework or direct enforcement program has followed the election. [7]
Grayscale’s outlook, cited in analysis of the new Congress, expects industry growth to retain support from institutional adoption and bipartisan interests. Those expectations compete with concerns that policy uncertainty could slow institutional participation. [7]
Avoid turning an election result into a Bitcoin price projection. Regulation can affect market access, issuer behavior, and compliance costs over time, but the immediate chart remains driven by liquidity, positioning, and macro news.
Pick a method that matches your time horizon
Crypto Banter outlined four distinct responses to a falling market: grid trading, waiting for a confirmed reclaim, dollar-cost averaging through volatility, or placing tightly defined orders to catch a decline. These approaches carry different costs and failure modes.
Grid trading depends on a range holding, so a sustained trend can turn repeated entries into a growing losing position. A confirmation approach can miss the initial rebound, but it avoids assuming that the first support touch marks the low.
Dollar-cost averaging spreads entry timing but leaves you exposed if the asset keeps declining or if the total allocation is too large. Attempts to catch a falling market require predetermined exit conditions, not an assumption that every major drawdown must reverse quickly.
We would favor clarity over prediction. A written process that states what confirms a trend, what invalidates it, and how much capital is at risk is stronger than a “Santa rally” narrative based on seasonal patterns.
Define what would change your view
For the bullish case, watch whether Bitcoin can reclaim the band analysts place between the low-$73,000s and high-$78,000s, then recover the $81,200 level identified by Crypto Banter. Those are separate hurdles, not one signal. [1][2]
For the bearish case, monitor whether weekly closes remain below the moving-average band and whether Bitcoin loses the $70,000 area highlighted by Crypto Banter. Cowen’s view was that a fourth-quarter low had not yet been established.
A third outcome is extended range trading, where neither buyers nor sellers gain control. K33’s Lunde described the present market as resembling the dull periods of 2023, but he also said the four-year cycle may weaken as issuance from halvings becomes less significant.
Update the chart after each weekly close, then compare it with ETF flows, funding, liquidations, macro conditions, and custody headlines. That routine will not predict Bitcoin’s next move, but it can stop one metric from carrying more weight than it earns.
Frequently Asked Questions
What are the key Bitcoin support levels to watch in November 2026?
Key support levels include the 20-week simple moving average (SMA) and the 21-week exponential moving average (EMA), which together form the bull market support band. Analysts noted contested support near roughly $73,814, with some readings of the 20-week SMA ranging from about $73,331 to $78,996 depending on data sources and calculation dates. A reclaim of support would require a close above these levels and sustained price holding.
How is the 20-week moving average calculated for Bitcoin?
The 20-week simple moving average is calculated by averaging the closing prices of Bitcoin over the previous 140 days (20 weeks). Different data feeds and cutoff times can lead to variations in the exact value, so it is important to specify the source and date when citing this indicator.
What does a wick into a moving average indicate for Bitcoin price?
A wick into a moving average indicates that the price reached a level where buyers appeared, causing a temporary bounce. However, this does not confirm support unless the price closes above the moving average and holds it through subsequent sessions.
How do ETF outflows affect Bitcoin support levels?
Large ETF outflows can increase selling pressure and contribute to the risk that technical support levels may fail. For example, U.S. spot Bitcoin ETFs experienced significant net outflows in late October 2026, which coincided with increased liquidation and downward pressure on Bitcoin’s price.
How should traders interpret Bitcoin Fear and Greed Index in relation to support?
The Fear and Greed Index reflects market sentiment but should not be used alone to predict price direction. When the index shows fear, traders may be reluctant to add risk and should seek stronger confirmation from price action and market structure before assuming a durable low. Fear can persist through multiple weekly declines.
How we researched this
This article was assembled from 5 video sources across 4 channels, 11 cited references.
Nothing here is based on hands-on testing. Where a figure or finding appears, it belongs to the source cited beside it, and the writing says so rather than implying otherwise. Every source is listed below so you can check it.
Sources
Bitcoin Falls to the Bull Market Support Band, Benjamin Cowen
Bitcoin After the Midterms: AI Selloff, Hacks & Upcoming Fed Meeting, Santa Rally Next?, Crypto Casey
CAUTION: Bitcoin Bulls LOST The Only Level That Matters! [What’s Next?], Crypto Banter
Bitcoin Is Repeating 2023, Lark Davis
Bitcoin: Close Your Eyes & Buy? [My Plan Of Action], Crypto Banter
Bitcoin Bull Market Support Band: Live Chart and How to Read It
Bitcoin and crypto regulation: implications of a Democratic Congress
Bitcoin shrugs off Binance hack: Fitch - Investment Executive
Bitcoin Selling Pressure Mounts as ETF Outflows Meet Crypto Liquidations | E8 Markets Blog
Watch Bitcoin Technical Analysis and Market Sentiment on Youtube
Also from the sources
Related Articles

Bitcoin 21-Week EMA Analysis: Key Support and Market Risks
Explore Bitcoin 21-week EMA analysis, support levels, and how recent events like the Binance hack affect market outlook and price risks.
Bitcoin and Crypto Market Technical Analysis and Trading Strategies
Explore Bitcoin and crypto market technical analysis, key price levels, liquidity insights, and practical trading strategies for October 2026.

Bitcoin Technical Analysis and Trading Strategies Explained
Learn bitcoin technical analysis, key support/resistance levels, volume signals, and trading strategies to navigate crypto market movements effectively.
Bitcoin Bull Market Signals and Price Rally Analysis
Explore Bitcoin bull market signals, ETF inflows, and price rally factors shaping the current market conditions and potential trends.