
Bitcoin and Crypto Market Technical Analysis and Trading
Explore Bitcoin and crypto market technical analysis, key price levels, liquidity insights, and practical trading strategies for October 2026.
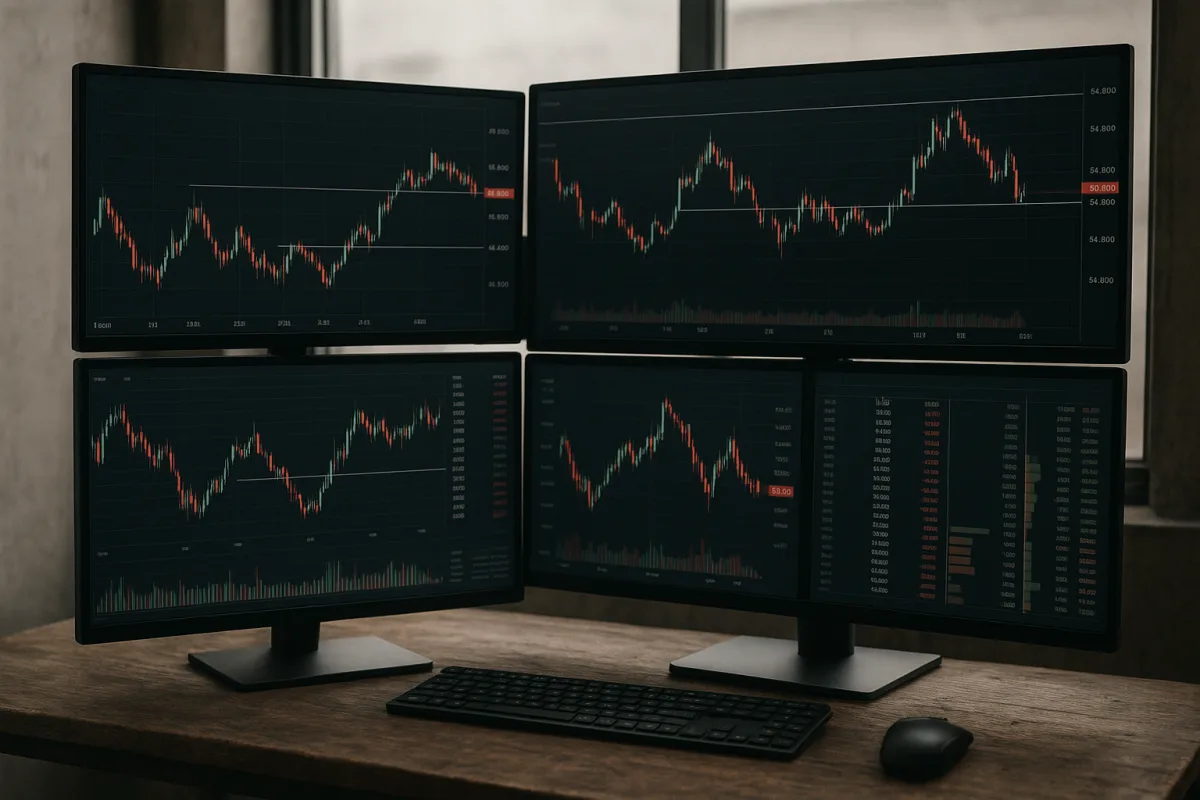
Start with the market you are actually trading
Bitcoin has stabilised after a volatile mid-October stretch that took it from roughly $83,700 to below $81,000, while forcing about $771 million of liquidations. By October 20, Bitcoin traded near $81,798, a recovery without a confirmed breakout. [12][13]
The immediate risk is not simply that Bitcoin falls. It is that traders mistake a range for a trend, add leverage during low-liquidity hours, and discover that altcoins do not have Bitcoin’s depth when stops begin to trigger.
That distinction matters. CoinDesk and KuCoin reported that Bitcoin and Ethereum market depth had improved markedly from October 2025, with Bitcoin depth within 1% of market price up about 75%, while Ethereum depth within 0.5% more than doubled. [5][6]
Altcoin conditions are different. KuCoin and Flux.Fund described falling depth and sharply lower spot activity across the long tail of tokens, even as derivatives exposure remained elevated. Weekly altcoin spot volume was nearly two-thirds below crash-week levels earlier in 2025. [5][7]
For a practical trading plan, that means Bitcoin levels can be treated as relatively clean reference points. An altcoin chart should be treated as a less reliable execution environment, especially if the intended entry or exit depends on a narrow price level.
Define the Bitcoin range before looking for a trade
The most useful current Bitcoin levels are close together. Fullswing.ai identifies $81,406 as nearest daily support, while CoinDCX places dynamic support at $80,340. The first resistance is about $81,996, with $84,000 cited as a near-term upside objective. [2][3]
This leaves traders with a simple problem: price is near the middle of an important decision area, rather than at an obvious extreme. Buying or shorting in the middle can make the eventual invalidation point too distant relative to the likely reward.
A range-based framework would therefore separate three scenarios. The first is a hold above $81,406, followed by a reclaim of $81,996. The second is a loss of $81,406 and a test of $80,340. The third is a move through $84,000. [2][3]
None of those outcomes confirms a long-term price forecast. A resistance break can fail, and support can break briefly before reversing. The actionable point is to make the trade conditional on the level, rather than assuming the level will hold.
Crypto Banter’s market presenters used a comparable method in their recent streams. They described Bitcoin as compressed between liquidity above and below price, and treated a confirmed reclaim or rejection as more useful than trying to predict the first impulse.
Their quoted levels, including a $76,000 versus $86,000 range and later references to $77,000 and $74,000 support, are not current anchors. They are useful as examples of scenario planning, but the October 20 research levels are closer to the market now. [2][3]
Wait for confirmation instead of trading the first touch
The common technical mistake in a volatile range is entering the moment price touches support or resistance. A Crypto Banter trader outlined a more selective approach for weekend conditions: wait for a one-hour candle close back inside the chosen zone before acting.
That approach is particularly relevant when liquidity is thinner. Crypto markets trade continuously, without the circuit breakers that halt some equity-market trading, and a sudden headline can move a thin weekend book faster than a chart-based stop can reasonably anticipate. [13]
A confirmation rule does not make a setup safe. It simply defines what evidence would distinguish a support test from a breakdown. For Bitcoin, a trader watching $81,406 might require price to reclaim it after dipping below, rather than assuming the first bounce is durable. [2]
The same logic applies at resistance. A brief move above $81,996 is not necessarily a breakout. A close above it, followed by a successful retest, is a more demanding standard, though it can also mean accepting a less attractive entry price. [2]
Crypto Banter’s presenters repeatedly framed these moves as conditional. One described $85,000 as a level Bitcoin needed to regain to turn a weak weekly structure more constructive. That is a chart interpretation, not evidence that Bitcoin must rally once it trades there.
Separate Bitcoin setups from altcoin setups
Altcoins fell harder than Bitcoin during the latest bout of traditional-market anxiety. Decrypt reported Bitcoin down 1.4% on the week at $82,161, compared with weekly declines of 5.3% for Ether, 6.2% for Solana and 7.2% for XRP. [13]
That performance gap is not unusual in a risk-off move. It also affects strategy design. A trader using a Bitcoin support level as the trigger for an altcoin position is taking two risks at once: Bitcoin may fail, and the altcoin may underperform even if Bitcoin holds.
Crypto Banter’s chart commentary illustrated the distinction. One presenter regarded Bitcoin as still holding range support while describing Ether, XRP and Solana as having lost their respective support zones and potentially retesting prior support as resistance.
The presenter’s specific short ideas, including Ether near $2,440 to $2,450, XRP around $1.41 to $1.43, and Solana near $105, were short-term chart views from a particular market session. They are not current levels or durable forecasts.
The more transferable method is the structure: identify whether an asset retained support, lost support, or reclaimed it. For an altcoin, also check spot volume and visible order-book depth before assuming a tight stop can be executed near its intended price. [5][7]
This is where broad “altseason” claims deserve scepticism. The overall crypto market capitalisation remained high near $2.79 trillion, but that does not mean smaller tokens have sufficient spot demand or liquidity to support aggressive trading. [5][7]
Build the risk plan before placing an order
Technical analysis becomes a trading strategy only when the trader specifies what would prove the idea wrong. A level without invalidation is commentary. It does not answer how much can be lost if price moves against the thesis.
Crypto Banter’s contributors offered two practical templates. One was to scale into an entry, using part of the planned position at the first level and reserving the balance for a deeper move. Another was to use a candle close beyond invalidation rather than reacting to every wick.
Both approaches have costs. Scaling in can magnify losses during a genuine breakdown. Candle-close exits can incur more loss than a hard stop during a fast cascade. Which mechanism fits depends on liquidity, leverage and the trader’s tolerance for gap-like moves.
The streams also stressed partial profit-taking. One presenter described reducing a position in roughly one-third increments as price approaches successive objectives, leaving a smaller remainder for a larger move. This is risk management, not evidence that a target will be reached.
That matters after a liquidation-heavy week. Leveraged positions can be closed automatically when the market is moving fastest, eliminating the chance to wait for a preferred technical signal. The October 14-19 liquidation figure is a reminder that leverage changes the trade mechanics. [12]
Check macro signals, but do not invent a causal story
Crypto Banter’s analysts have watched the VIX, the Nasdaq, oil and the U.S. dollar alongside Bitcoin. That is reasonable context because risk assets often move together during a broad equity sell-off, but the available evidence does not establish a fixed causal relationship.
The October fear around a potential “Black Monday” showed the limitation. Decrypt reported ETF outflows of $548.5 million for the week, while subsequent reporting placed combined Bitcoin and Ether ETF outflows above $1 billion during the mid-month volatility. [13][12]
Those flows indicate institutional caution, not a guaranteed price direction. ETFs can see outflows while Bitcoin holds support, and inflows can occur without a technical breakout. The market response must still be read through price, volume and liquidity.
Regulation is also becoming more relevant to infrastructure rather than immediate chart targets. The SEC began a five-year pilot on October 13 allowing tokenized stock trading on public blockchains, with major exchanges and crypto platforms involved. [8]
Meanwhile, the Senate did not pass the CLARITY Act in September, followed by SEC and CFTC guidance on token classification and custody. These developments may affect market access and product design, but they do not provide a defensible basis for a short-term Bitcoin price prediction. [9]
Be cautious with automated and machine-learning signals
Trend-following systems and machine-learning models are attractive during periods of compression because they promise to identify the eventual expansion. But model output is only as useful as its assumptions about trading costs, liquidity and the market regime.
Research on walk-forward Bitcoin models found positive gross results could deteriorate sharply once realistic transaction costs of roughly 10 basis points were included. That is especially relevant for frequent trading systems that appear to exploit small price changes. [1]
Some trend-following strategies report strong risk-adjusted results, including an AdaptiveTrend Sharpe ratio of 2.41 in the research brief. That metric does not remove drawdown risk, and it does not establish that the same parameters will work in the next volatility regime.
For traders evaluating a signal service or automated strategy, the practical questions are narrower: Does it include fees, spread, slippage and funding? Does it trade liquid Bitcoin and Ether markets, or thinner altcoins? Does it publish losing periods as clearly as winning ones?
A system that relies on rapid entries and exits faces a larger problem in altcoins, where declining liquidity can turn a back-tested fill into an unrealistic live fill. The chart may be valid, while the trade implementation is not. [5][7]
Frequently Asked Questions
What are the key Bitcoin support and resistance levels in October 2026?
As of October 20, 2026, Bitcoin traded near $81,798. The nearest daily support is identified at $81,406, with a secondary dynamic support around $80,340. Resistance levels to watch are about $81,996 and a near-term upside target near $84,000. These levels frame the current trading range without confirming a long-term trend.
How does liquidity affect Bitcoin and altcoin trading execution?
Bitcoin and Ethereum have regained significant order-book depth, improving execution quality. Bitcoin’s market depth within 1% of the market price increased by about 75%, and Ethereum’s liquidity more than doubled within 0.5%. In contrast, altcoins face declining liquidity and spot trading volumes, making execution risk materially higher for trades outside the largest tokens.
What confirmation methods improve Bitcoin trade entries?
A technical setup for Bitcoin trades should include a clearly defined invalidation level, a position-size limit, and a profit-taking plan before entry. This approach is especially important after recent volatility and liquidations, ensuring trades are conditional on key support or resistance levels rather than mid-range guesses.
How should traders manage risk in volatile crypto markets?
Traders should avoid mistaking trading ranges for trends and be cautious with leverage, particularly during low-liquidity periods. Using defined stop-loss levels and limiting position sizes helps manage risk, as demonstrated by the $771 million liquidations during the mid-October 2026 sell-off. A disciplined approach with clear invalidation points is essential.
What impact do market depth and order-book liquidity have on crypto trading?
Greater market depth and order-book liquidity reduce execution risk by allowing larger trades with less price slippage. Bitcoin and Ethereum’s improved liquidity supports more reliable trade execution, while altcoins’ declining depth and spot volume increase the likelihood of poor fills and higher slippage, complicating trade entries and exits.
How we researched this
This article was assembled from 5 video sources, 1 published article, 13 cited references.
Nothing here is based on hands-on testing. Where a figure or finding appears, it belongs to the source cited beside it, and the writing says so rather than implying otherwise. Every source is listed below so you can check it.
Sources
Altcoins Are About To Explode After This Dip (But Not Yet!) — Crypto Banter
URGENT: Last Time We Saw This Signal The Market Moved Like Crazy! [My Trade Plan] — Crypto Banter
Crypto Is Setting Up for Something This Weekend — Crypto Banter
THIS IS IT: Bitcoin Bulls Must Hold This EXACT Level Or We Dumping Hard! — Crypto Banter
Top Altcoins To Accumulate For The Next Incoming Pump — Crypto Banter
Morning Minute: Crypto Rebounds as 'Black Monday' Looms — Decrypt
Bitcoin (BTC) Key Levels Today: Daily, Weekly & Monthly Pivots
Bitcoin Price Outlook: October 2026 Support and Downside Forecasts
Bitcoin (BTC) and ether (ETH) liquidity rebounds a year after $19 billion crypto flash crash
SEC Paves the Way for Blockchain Stock Trading in Landmark Shift
Crypto Market Absorbs 'Black Monday' Fear Spike as Bitcoin and Ethereum Rebound
‘Black Monday’ Fears Grip Crypto Twitter After Bitcoin, Ethereum and $33M AI Perps Flash Crash
Watch Bitcoin and Crypto Market Technical Analysis and Trading Strategies on Youtube
Also from the sources
Related Articles

Bitcoin Technical Analysis and Trading Strategies Explained
Learn bitcoin technical analysis, key support/resistance levels, volume signals, and trading strategies to navigate crypto market movements effectively.
Bitcoin Trading Strategies and Market Technical Analysis
Explore Bitcoin trading strategies and technical analysis to manage risk and plan trades using weekly chart confirmation and breakout levels.

XRP Price Predictions: Ripple vs. SEC News & $100 Forecast Analysis
Discover Crypto explores xrp price predictions amid breaking news on the Ripple vs. SEC lawsuit. Insights on regulatory shifts, ETF applications, and $100 xrp forecasts are discussed, alongside Cold Storage recommendations and technical analysis for potential $8 and $20 xrp targets.
Bitcoin Price Volatility and Market Outlook in 2026
Explore Bitcoin price volatility, key support levels, ETF impacts, and market outlook for 2026 in this detailed analysis.