
Bitcoin Trading Strategies and Market Technical Analysis
Explore Bitcoin trading strategies and technical analysis to manage risk and plan trades using weekly chart confirmation and breakout levels.
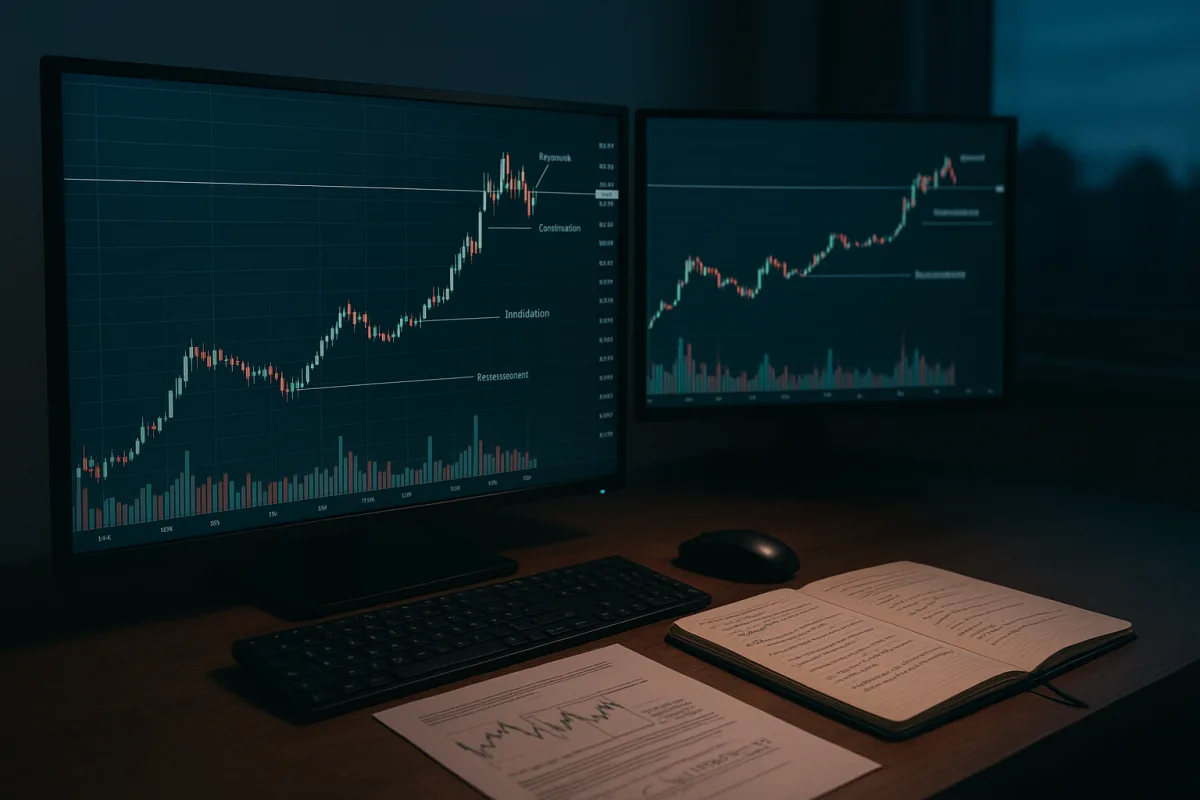
Start with the market structure, not the headline
Bitcoin entered the week after closing September 21 at $86,602.91, having traded between $80,867.08 and $87,363.76 during that week. By September 23, spot Bitcoin was near $84,330. [3] That is a meaningful weekly recovery, but it is not a straight-line breakout.
The risk appears immediately in the gap between the weekly close and the current spot price. Bitcoin approached $87,400, then reversed into a liquidation event dominated by leveraged long positions on September 22. [10] A trader buying the headline breakout without a defined exit would have been exposed to precisely that reversal.
Lark Davis, a market commentator on the Lark Davis channel, identifies Bitcoin’s move above a previous lower high near $82,500 as a possible change from a lower-high structure to one of higher highs and higher lows. That is a useful chart observation, but it requires follow-through.
The practical test is not whether Bitcoin briefly trades above a level. It is whether a daily and then weekly close can hold above it, followed by a retest that produces a higher low. A wick above resistance followed by a close below it is a failed breakout, not confirmation.
Coin Bureau similarly noted Bitcoin’s move above its 50-week moving average after an extended period below it. Moving averages can help define trend context, but they lag price. They should be treated as reference points, not automatic buy or sell signals.
Define the trade before Bitcoin reaches resistance
The nearest visible decision zone is the $87,000 to $90,000 area identified by Crypto Banter’s pullback analysis. The channel described it as an area where Bitcoin could either break higher or reject into support, rather than a level that guaranteed further gains.
A trader using that setup would need to decide which event they are trading. One approach is a confirmed breakout, requiring a close above resistance and evidence that the former ceiling has become support. Another is a pullback trade, requiring a defined support response after rejection.
Those are different trades with different risks. Buying at $88,000 because price is rising assumes continuation. Buying after a retreat to a support zone assumes the decline is temporary. Combining the two narratives after entering is how a short-term trade turns into an unplanned long-term holding.
Crypto Banter identified liquidity zones around $84,000 and $80,000 in its short-term analysis, while arguing that an extended failure below $89,000 could open a deeper retracement toward $74,000. These are analyst scenarios, not price forecasts, and should be read as potential invalidation areas.
The levels matter because Bitcoin has repeatedly shown that a move of several percentage points can erase leveraged positions. More than $200 million of leveraged Bitcoin longs were liquidated after a $3,000 hourly drop on February 5, while a June decline of 3.08% produced roughly $1.7 billion to $1.8 billion in liquidations. [10]
Use weekly confirmation to avoid trading every intraday move
The cleaner workflow is to start with the weekly chart, move to the daily chart for confirmation, and use intraday charts only for execution. That hierarchy reduces the chance of treating a one-hour spike as a durable structural shift.
The weekly chart currently supports a cautiously constructive case because Bitcoin reclaimed levels that had acted as resistance. The counterargument is equally clear: price has not established a sustained series of higher weekly highs, and the spot retreat after the $87,400 squeeze shows sellers remain active. [3][10]
Coin Bureau reported that Bitcoin rose sharply despite a Senate setback for the Clarity Act and tighter monetary conditions. The failed Senate vote is independently confirmed, but it does not remove regulatory risk. [2] A resilient price response is evidence of demand, not immunity from policy shocks.
Traders should therefore avoid assigning too much weight to one catalyst. A rate decision, ETF flow, liquidation cluster or legislative vote can move Bitcoin quickly, but technical confirmation needs to survive after the headline passes and leverage has been flushed from the market.
The CFTC’s approval of Bitcoin perpetual futures on KalshiEX has expanded access to a regulated form of perpetual exposure in the United States. [4] That may improve market infrastructure, but perpetual contracts remain leveraged instruments whose funding costs and liquidation mechanics can amplify volatility.
Treat liquidations as market mechanics, not direction forecasts
Liquidation data can explain why a move accelerates, but it does not reliably predict where price will settle. When a short is force-closed, the venue buys to close the position, adding demand. When longs are liquidated, forced selling adds supply.
That mechanism helped fuel the recent rally toward $87,400, then intensified the decline once long positions became vulnerable. [10] The useful takeaway is that crowded positioning creates unstable price conditions on both sides, especially near well-publicised chart levels.
Crypto Banter’s analysis of a possible “trap zone” is consistent with this risk. The channel warned that Bitcoin could spend time chopping below resistance, repeatedly triggering traders who expect either an immediate breakout or an immediate collapse.
For a practical setup, traders can monitor price, open interest and volume together. Rising price with rapidly rising open interest may indicate fresh leverage entering the move. A breakout supported by spot volume and modest futures positioning is generally less fragile than one driven primarily by perpetual futures.
This is not a guaranteed signal. Open interest can rise during sustainable trends, and falling open interest can occur in healthy consolidations. It is simply a way to identify when the cost of being wrong may be unusually high.
Size exposure for a market that can gap through levels
Crypto Banter has promoted a “barbell” allocation concept, pairing high-volatility crypto exposure with less volatile conventional-market positions. The logic is understandable, but calling the other side safe would be inaccurate, especially where leveraged equity products are involved.
The channel has discussed instruments including MAGX, a leveraged product tied to the largest US technology stocks, and QQQ3, a leveraged Nasdaq-linked product. Leveraged exchange-traded products can magnify gains and losses, often reset daily, and are not a simple hedge against crypto volatility.
The underlying diversification problem is real. Research cited in the reporting brief found that 83.35% of crypto accounts hold a single asset, leaving portfolios concentrated in one price driver. Concentration may work during a rally, but it does not reduce the risk of a sudden macro or liquidity shock.
Traditional markets also face their own stress points. CoinDesk reported Michael Burry’s description of a tokenized silver liquidation episode as a “collateral death spiral,” illustrating that collateralised and tokenised products can transmit stress rather than dilute it. [8]
A more defensible risk process is to set maximum exposure at the portfolio level before choosing individual trades. That means accounting for correlated positions, such as Bitcoin, Ethereum, high-beta altcoins, crypto equities and perpetual futures, which may all decline together in a risk-off event.
Screen altcoins for confirmation, not excitement
Altcoin trades should begin with a tougher filter because liquidity is thinner, narratives change faster and downside can be sharper. A token that has already risen materially is not automatically a breakout candidate merely because it has relative strength.
Crypto Banter’s first trade-focused broadcast flagged PUMP, the Pump.fun-related token, as a potential higher-low and continuation setup. It also highlighted relative strength in Hyperliquid’s HYPE token and in smaller names including TOWER and VV, while explicitly cautioning viewers not to chase VV at all-time highs.
The same channel’s later market update named Injective and NEO Protocol as tokens still moving higher while Bitcoin dominance weakened. These are examples of rotation, not proof of a broad altcoin season. Traders should distinguish a handful of leaders from a market-wide trend.
The independent research brief identifies ONDO, TRX, PULSE and NEXUS as additional tokens with technically positive signals. ONDO was reported above its former $0.31 resistance at about $0.43, while TRX was near $0.34 with support cited around $0.31. Those levels can change quickly.
PULSE was reported above its 20-day exponential moving average after a 180% volume increase, while NEXUS was said to have a recovering relative-strength index and reported whale accumulation. These are suggestive indicators, not independently verified evidence of future appreciation, and live charts should be checked before acting.
Hyperliquid’s HYPE requires particular caution. The research brief cites consolidation near $64.76 but also a current price of $94.96, a discrepancy large enough to make the setup unusable without confirming the timestamp, market venue and chart data.
For any of these tokens, the minimum checklist is straightforward: confirm the current market price, check whether volume is rising with price, identify the prior breakout level, and establish the level that invalidates the thesis. If those inputs cannot be verified, the setup is speculation.
Keep regulation and macro conditions in the trade journal
Bitcoin’s latest rise occurred against a mixed policy backdrop. The Senate blocked the Clarity Act after concerns around President Donald Trump’s crypto interests complicated the legislation, leaving comprehensive US crypto rules unresolved. [2]
At the same time, the SEC has conditionally opened a five-year pathway for certain crypto-style trading of US stocks. [1] The SEC’s Regulation Crypto Assets proposal also remains at the proposal stage, which means the rulebook is still moving rather than settled. [6]
Outside the US, the EU’s MiCA framework is fully implemented, yet regulatory friction persists. Reporting on global crypto rules noted that European Central Bank President Christine Lagarde blocked Binance’s European licence during September over compliance concerns. [7]
These developments matter for market access, exchange operations, token listings and institutional participation. They do not, however, convert a chart breakout into a certainty. The proposed American Reserve Modernization Act, including a 20-year lockup concept for a Strategic Bitcoin Reserve, remains a House bill rather than enacted policy. [5]
The workable discipline is to record why a trade exists, what would prove it wrong, and which external event could make the chart irrelevant. In Bitcoin markets, that last category includes regulatory announcements, rate expectations, ETF flows and forced liquidations. Technical analysis can organise risk, but it cannot eliminate it.
Frequently Asked Questions
What are effective Bitcoin trading strategies for volatile markets?
Effective strategies involve defining trades clearly before price reaches resistance, such as planning for either a confirmed breakout or a pullback trade. Traders should avoid reacting to headlines alone and use technical levels like support and resistance to guide entries and exits. Managing leverage risk is crucial since rapid price moves can trigger large liquidation cascades.
How can I use weekly chart confirmation in Bitcoin trading?
Start with the weekly chart to identify key levels and trend context, then use the daily chart for confirmation of moves. Intraday charts should be reserved for trade execution rather than decision-making. A weekly close above resistance followed by a higher low retest is needed to confirm a breakout, while a wick above resistance that closes below it signals a failed breakout.
What is a breakout plan for Bitcoin trading?
A breakout plan requires three predefined levels: the confirmation level where the breakout is validated, the invalidation level where the trade idea fails, and the point at which gains are reduced or reassessed. This structured approach helps avoid speculative trades based on price targets alone, such as aiming for “Bitcoin to $100,000” without defined risk controls.
How do liquidations affect Bitcoin price movements?
Liquidations, especially of leveraged long positions, can cause rapid and sharp price reversals. For example, a short squeeze near $87,400 was quickly followed by a long-liquidation cascade that pushed prices down. Large liquidation events, like those involving hundreds of millions or billions of dollars, amplify volatility and can erase significant gains or losses in a short time.
What risk management techniques are important in Bitcoin trading?
Risk management includes defining entry and exit levels before trading, using confirmation from higher timeframes to avoid false signals, and carefully managing leverage to prevent liquidation cascades. Traders should also be cautious about mixing trade narratives mid-position and avoid overreacting to single news events or price spikes, focusing instead on sustained technical confirmation.
How we researched this
This article was assembled from 5 video sources across 3 channels, 10 cited references.
Nothing here is based on hands-on testing. Where a figure or finding appears, it belongs to the source cited beside it, and the writing says so rather than implying otherwise. Every source is listed below so you can check it.
Sources
SIDELINED? | Here's 3 Trades To Get You Some Crypto Exposure! — Crypto Banter
Bitcoin Just Flipped NOW IS When It Gets Crazy — Lark Davis
Why Bitcoin Just EXPLODED — Coin Bureau
These Altcoins Are Going To Breakout In A BIG Way! [Don't Wait] — Crypto Banter
Pullback Warning! Bearish Signal Flashing — Crypto Banter
Senate blocks cryptocurrency regulation as Democrats push back on Trump investments
CFTC approves bitcoin perpetual futures; SEC and CFTC define crypto framework
SEC Proposes New Cryptocurrency Rules: Regulation Crypto Assets - Hinckley Allen
'Big Short' Michael Burry flags “death spiral” after silver liquidations beat bitcoin
Crypto Markets Absorb $386M Liquidation Wave As Fed Rate Hike Odds Hit 60.2% | OneBullEx
Bitcoin Drops 3.08% Amid Liquidation Cascade and ETF Outflows | Top Stories | CoinMarketCap
Watch Bitcoin Market Technical Analysis and Trading Strategies on Youtube
Also from the sources
Related Articles

Bitcoin Technical Analysis and Trading Strategies Explained
Learn bitcoin technical analysis, key support/resistance levels, volume signals, and trading strategies to navigate crypto market movements effectively.

XRP Price Predictions: Ripple vs. SEC News & $100 Forecast Analysis
Discover Crypto explores xrp price predictions amid breaking news on the Ripple vs. SEC lawsuit. Insights on regulatory shifts, ETF applications, and $100 xrp forecasts are discussed, alongside Cold Storage recommendations and technical analysis for potential $8 and $20 xrp targets.

XRP Price Surge: Predicting Market Expansion and Alt Season
Blockchain Backer analyzes XRP's price surge post-SEC news, predicting a market expansion. Insights on corrective structures and technical indicators signal a potential alt season, offering a thrilling outlook for cryptocurrency enthusiasts.

XRP Surges 10% as SEC Drops Case: Ripple's Legal Victory and Market Impact
XRP skyrockets 10% to $247 as SEC drops case against Ripple. Legal victory sets precedent for crypto industry. Ripple's $200M defense fund defends entire market. Altcoins surge; XRP in the lead. CryptosRUs teases DCA night livestream for more insights.