
Bitcoin Price Action and Market Outlook October 2026
Analyze Bitcoin price action and market outlook amid inflation, ETF flows, and macro pressures in October 2026.
The quick list
Best overall: Range continuation, for market participants waiting for confirmed inflation and ETF-flow data.
Best for macro clarity: Upside breakout above $85,600, for analysts looking for easing inflation pressure, lower yields and renewed fund demand.
Best for downside planning: Support failure below $82,000, for risk teams assessing the possibility of a return toward the high-$70,000s.
The practical question for Bitcoin market participants is not whether Bitcoin can eventually revisit six figures. It is whether the current $83,000 area represents a base for renewed demand or a pause before macro pressure produces another leg lower.
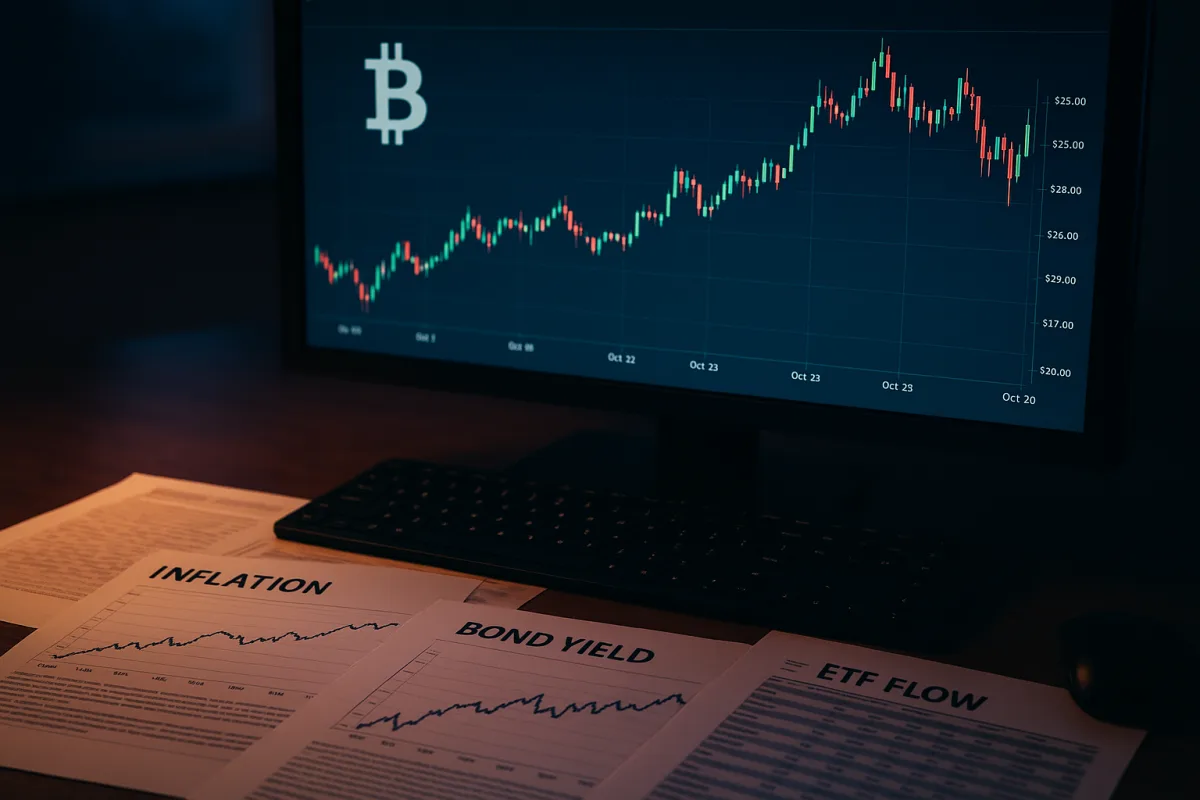
Bitcoin traded around $83,000 to $85,000 during the first half of October, depending on the pricing source and observation time. BitcoinBTCsats places the month’s range at roughly $83,556 to $84,853, while StatMuse calculates an average price of $83,679.46, compared with BitcoinBTCsats’ $84,191 average. [2][3]
Those small discrepancies are normal for a continuously traded asset quoted across venues. They also underline the main point: Bitcoin has been range-bound, not in a confirmed directional trend, and the difference between $83,500 and $84,800 is modest beside the market’s wider technical thresholds.
The second-order risk is macro. Higher oil prices and inflation concerns have pushed long-dated Treasury yields above 5%, making cash and government debt more competitive with volatile assets whose return is uncertain. [11][12]
That does not prove yields caused Bitcoin’s weakness. Crypto markets are influenced by leverage, derivatives liquidations, ETF creations and redemptions, offshore liquidity and risk sentiment. Still, the relationship is plausible, and it has become the central explanation offered by several market analysts.
Comparing the three Bitcoin market outlooks
| Outlook | Key price area | Market structure | ETF and liquidity signal | Macro condition that would fit | Main trade-off |
|---|---|---|---|---|---|
| Range continuation | About $83,556 to $84,853 | Sideways market with no confirmed trend | Mixed flows, limited conviction | Inflation and yields remain elevated but do not worsen materially | Lower immediate directional risk, but repeated false breakouts can increase short-term trading losses |
| Upside breakout | Above $85,600, then around $87,395 | Resistance turns into support on stronger volume | ETF outflows slow or reverse, broader risk appetite improves | Softer-than-expected CPI or PPI reduces rate-hike concerns | A cooler print may be temporary, and a price breakout can fail if yields remain high |
| Downside support failure | Below $82,000, with $79,000 cited as the next risk area | Weekly support weakens, reopening a lower range | Persistent ETF outflows and reduced spot demand | Inflation surprises higher, oil stays firm or long-term yields rise further | Downside targets are technical estimates, not forecasts, and a sharp selloff can reverse quickly |
The range case is the least dramatic and, based on the available data, the most consistent with what Bitcoin has actually done. Historical October figures compiled by BitcoinBTCsats and StatMuse show a narrow band near the mid-$80,000s rather than a sustained move toward either $90,000 or $80,000. [2][3]
That matters because a sideways market can look deceptively calm while leverage builds underneath it. Traders can be repeatedly drawn into small moves above resistance or below support, only for prices to return to the middle of the range.
Bitfire told Decrypt that Bitcoin had been trading broadly between about $80,300 and $87,100, with $85,600 identified as a level that could open a move toward $87,395 if volume improves. The same analysis put $82,000 and then $79,000 in focus on the downside.
Those are scenario markers rather than fundamental valuations. Bitcoin does not generate cash flows, so chart levels describe where prior buying and selling occurred, not what the asset should be worth under a discounted-cash-flow framework.
Best overall: the range continuation case
The range case suits observers who need confirmation rather than a narrative. Bitcoin was quoted at $85,412 on Oct. 6, with a market capitalization of $1.72 trillion and 24-hour trading volume of $26.95 billion, showing that a large and liquid market can still struggle to establish direction. [7]
The cost of this view is opportunity risk, not a direct financial recommendation. If inflation comes in softer and yields retreat, Bitcoin could move through resistance before range-focused traders have a clear confirmation signal.
Conversely, the range case is vulnerable to a negative macro surprise. August CPI was 3.4% year over year, while PPI was 5.4% year over year, and September’s readings were pending as of Oct. 12. [4][5]
The market’s usual interpretation is straightforward but not guaranteed: cooler inflation can reduce expectations for further Federal Reserve tightening, while hotter data can do the opposite. The direct effect on Bitcoin has not been established quantitatively, and it should not be presented as mechanical.
Cointelegraph reported that traders were watching CPI and PPI releases ahead of the Oct. 28 Federal Open Market Committee meeting. Its cited consensus expected CPI to rise from August’s 3.4% annual rate to 3.7%, while PPI was expected to rise 0.3% month over month.
Best for macro clarity: the upside breakout case
The bullish case requires more than Bitcoin holding $83,000. It requires evidence that macro conditions are becoming less restrictive, especially a retreat in long-dated yields and a less aggressive interest-rate outlook.
The 10-year Treasury yield reached 5.24% and the 30-year yield 5.60% in the market reports cited by Decrypt and Cointelegraph. Those levels followed 52-week highs and represented multi-decade highs for yields, a difficult backdrop for speculative assets. [11][12]
A lower-than-expected inflation result could ease that pressure, at least initially. However, this is a conditional scenario, not a prediction. Oil prices, fiscal borrowing needs and growth expectations can keep yields elevated even if one inflation report is softer.
ETF flows provide another check on whether a rally has broader sponsorship. U.S. spot Bitcoin ETFs saw cumulative net inflows fall from roughly $63 billion at an October 2025 peak to about $54 billion by mid-June 2026 after a period of outflows. [8]
The picture improved sharply in September. A six-day inflow streak reached $2.84 billion, including a reported $999 million single-day record on Sept. 21, and the week ending Sept. 26 saw $2.4 billion in net inflows. [9]
Yet that demand was concentrated. BlackRock’s iShares Bitcoin Trust, or IBIT, reportedly absorbed about $5.1 billion of approximately $6.3 billion in third-quarter U.S. spot Bitcoin ETF inflows, equivalent to around 81% of the total. [10]
Concentration can amplify both directions. A dominant buyer can support spot demand when flows are positive, but a market relying heavily on one product may be exposed if that product’s investor base turns defensive. The effect on volatility is logical but has not been quantified by the supplied research.
Best for downside planning: the support-failure case
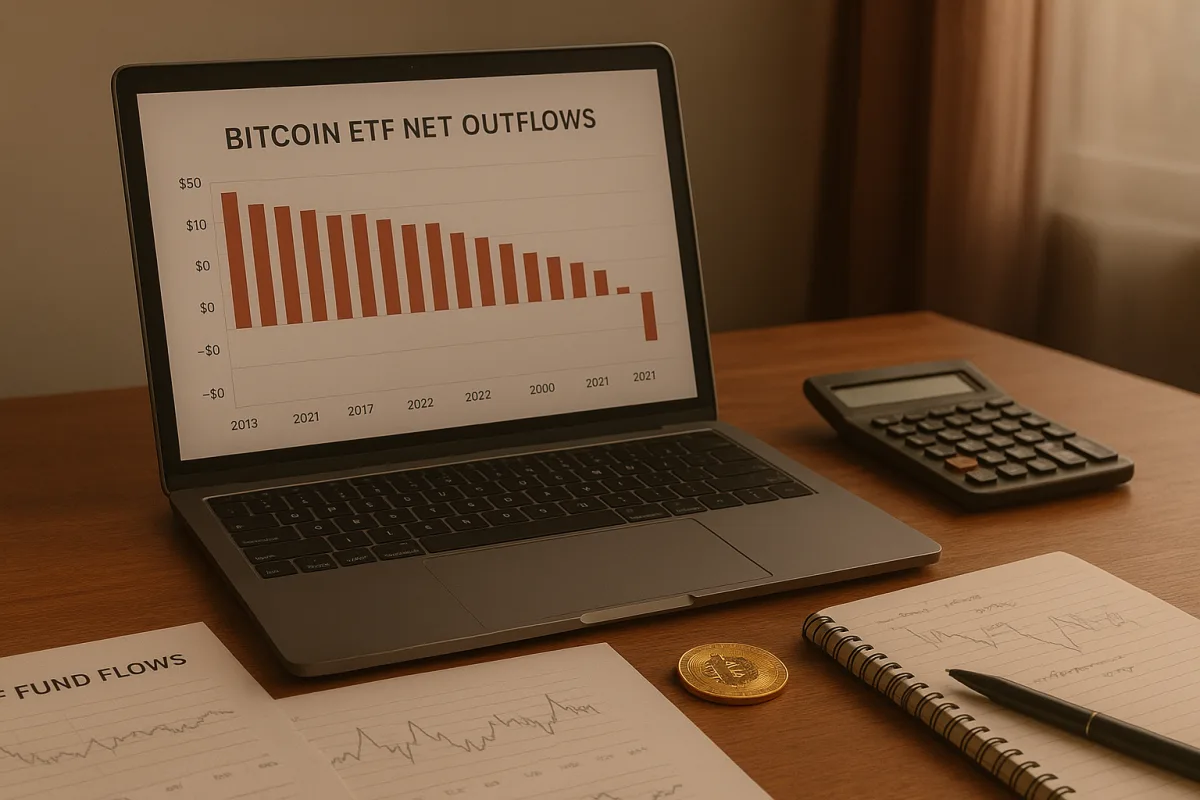
The bearish case starts with $82,000 rather than a dramatic collapse. CoinDesk reported that analysts regarded that level as crucial support after U.S.-listed spot Bitcoin ETFs recorded $681 million in weekly outflows, the largest since June according to SoSoValue data.
Bitcoin Magazine separately reported $729 million of U.S. spot Bitcoin ETF outflows across two days, alongside a Bitcoin price near $82,688. Those contemporaneous figures differ from the wider October historical range, likely because they reflect different timestamps and market sources.
The independent historical data should take precedence for the Oct. 12 price framing: Bitcoin traded broadly between $83,556 and $84,853 during the period measured. [2][3] The ETF reports remain relevant as evidence of short-term flow volatility, not as a settled explanation for every price change.
A break below $82,000 would therefore matter because it would signal that buyers failed to defend an area repeatedly cited by technical analysts. It would not prove that Bitcoin is entering a durable bear market, just as a break above $85,600 would not prove a new sustained advance.
Macro stress remains the main catalyst cited by the downside camp. Treasury yields above 5.3%, inflation’s erosion of purchasing power, higher mortgage costs and fiscal uncertainty can all reduce risk tolerance, although their specific effect on Bitcoin cannot be isolated cleanly. [1][11][12]
What the trading commentary gets right, and misses
Craig Percoco’s day-trading video focuses on short-term structure, defined losses and moving stops to break-even once a position develops. That is a trading process, not a market outlook, and it does not establish whether Bitcoin’s next macro-driven move will be higher or lower.
The video also shows why high-frequency technical signals can become unreliable around scheduled data. In the example, labor-market news produced a rapid selloff, and the trader acknowledged that the New York market open could create volatility without offering predictable direction.
Crypto Banter’s market commentary is more explicitly bullish. The channel argued that a further pullback, potentially toward $80,000 or $74,000, could create a buying opportunity and projected a later return by Bitcoin to the $100,000s.
Those targets are speculative price predictions. They rely on chart patterns, volume interpretation and a cyclical thesis, not on demonstrated causal evidence that inflation, bond yields or ETF flows will produce the stated outcomes.
The missing variable in much optimistic trading commentary is the cost of capital. If bonds offer yields above 5% and investors expect policy rates to remain restrictive, Bitcoin must compete for marginal capital without an income stream. [11][12]
Regulatory and infrastructure risks beneath the price chart
The market outlook is also shaped by infrastructure risks that do not show up immediately in Bitcoin’s candles. The Financial Stability Board has warned that stablecoins remain untested in a severe crisis and that differing national rules could complicate redemptions and insolvency claims.
That warning matters because stablecoins are widely used as crypto market settlement instruments and collateral. The FSB reported that the stablecoin market had grown from about $206 billion at the start of 2025 to $306 billion, mostly in dollar-linked tokens.
The regulatory response remains incomplete. The Block reported that former acting CFTC Chair Caroline Pham described proposed U.S. protections for retail crypto traders as the type of safeguards needed, while the independent research brief says CFTC rulemaking on leveraged retail crypto trading remains at an early stage.
Ethereum’s proposed EIP-7906 transaction assertions illustrate a related limitation. CryptoSlate reported that a transaction can enforce a minimum outcome only if the user’s protection rule is sound and cannot be weakened by the same application assembling the trade.
In other words, better market infrastructure can reduce some operational risks without removing price risk. A wallet can reject a bad execution result, but it cannot determine whether the market price before the transaction was sensible.
Who each option suits
Range continuation suits market participants who need to interpret confirmed data rather than anticipate it. Its central observation is that Bitcoin has remained near the mid-$80,000s, while inflation, yields and ETF flows have not yet supplied a durable directional signal. [2][3]
The upside breakout case suits analysts monitoring whether softer inflation, lower yields and stabilizing ETF demand arrive together. It is a conditional framework, not evidence that Bitcoin will clear $85,600 or reach the higher targets promoted by bullish commentators.
The downside support-failure case suits risk and treasury teams that need to model liquidity stress, ETF redemptions and a macro shock. Its key weakness is that technical downside levels identify areas to watch, not the probability or duration of a decline.
Across all three cases, the next CPI and PPI releases matter because they can change rate expectations quickly. They do not, on their own, provide a reliable formula for Bitcoin’s price, and any claim that they do should be treated as speculation.
Frequently Asked Questions
What is the current Bitcoin price range in October 2026?
Bitcoin has been trading within a range of approximately $83,556 to $84,853 during October 2026. Different sources report slight variations, with BitcoinBTCsats averaging about $84,191 and StatMuse around $83,679.46, reflecting normal discrepancies for a continuously traded asset.
How do inflation and Treasury yields affect Bitcoin price?
Higher inflation tends to keep Treasury yields elevated, raising the opportunity cost of holding volatile assets like Bitcoin. This dynamic pressures Bitcoin’s price downward as it is treated more like a risk asset rather than a macro hedge. While this relationship is plausible and widely discussed, it is not conclusively proven.
What are the key technical levels for Bitcoin in October 2026?
The critical technical thresholds are roughly $85,600 on the upside and $82,000 on the downside. A move above $85,600 could signal an upside breakout, while a drop below $82,000 may indicate support failure and a potential move toward the high-$70,000s. Movements within the $83,500 to $84,800 range are considered part of a sideways, range-bound market.
How do ETF flows influence Bitcoin market outlook?
ETF flows serve as a demand indicator but do not directly forecast Bitcoin’s price. In 2026, U.S. spot Bitcoin ETFs experienced large swings between inflows and outflows, with BlackRock’s IBIT accounting for about 81% of Q3 inflows. These flows affect liquidity and volatility but are only one factor among many influencing the market.
What scenarios could lead to Bitcoin price breakout or breakdown?
An upside breakout above $85,600 could occur if inflation pressures ease, Treasury yields decline, and ETF outflows slow or reverse, improving risk appetite. Conversely, a breakdown below $82,000 might follow higher-than-expected inflation, sustained high yields, and persistent ETF outflows. Both scenarios depend on macroeconomic developments and ETF activity rather than just technical signals.
How we researched this
This article was assembled from 2 video sources across 2 channels, 8 published articles, 12 cited references.
Nothing here is based on hands-on testing. Where a figure or finding appears, it belongs to the source cited beside it, and the writing says so rather than implying otherwise. Every source is listed below so you can check it.
Sources
LIVE DAY TRADING - How I Make $9,680 Risking $2k (My 10x Strategy) — Craig Percoco
Crypto Will Punish Traders Who Miss This Massive Buying Opportunity! — Crypto Banter
Global financial watchdog calls for cross-border information sharing, planning for stablecoin crisis — CoinDesk
Bitcoin Ranges Near $83K as Traders Look to US Inflation Data — Decrypt
BTC price support holds ahead of US CPI data: Three things Bitcoin traders need to know this week — Cointelegraph
Ethereum’s proposed safety checks could still let a bad trade through — CryptoSlate
Bitcoin ETFs Shed $729M in Two Days as Investors Reverse Course — Bitcoin Magazine
Bitcoin shrugs off ETF outflows to trade above $84,000 as oil falls — CoinDesk
Senate Democrat Presses Cantor Fitzgerald on Tether Ties and Lutnick Family Profits — Decrypt
Bitcoin price October 2026 in USD (United States Dollar) | BitcoinBTCsats
Consumer Price Index (CPI) — year-over-year prints & readings · The Distributed
US Producer Price Index October 2026: Date, Time & What to Expect | Finance Calendar
Bitcoin steadies as soft PCE cools October Fed rate hike bets | The Block
Bitcoin Holds $85,412 as October Fed Hike Odds Fall to 22.7% | Fazen Markets
Bitcoin ETF Inflows Turn Positive for 2026, Erasing $5.7B Hole | CoinMarketCap
What's Happening in the Bond Market Right Now (And Should You Adjust Your Portfolio?)
Bitcoin Falls Below $83K: Why Inflation Fears and Treasury Yields Are Pressuring BTC| KuCoin
Watch Bitcoin Price Action and Market Outlook Amid Macro Pressures on Youtube
Also from the sources
Related Articles

Bitcoin Market Outlook 2026: Price Predictions and Trends
Explore the Bitcoin market outlook 2026 with price predictions, institutional demand, and regulatory impacts shaping its future.

Bitcoin Price Volatility and Market Outlook in 2026
Explore Bitcoin price volatility, key support levels, ETF impacts, and market outlook for 2026 in this detailed analysis.

Ethereum Market Outlook 2026: Price, Adoption, and Risks
Explore Ethereum market outlook 2026 with insights on price recovery, institutional adoption, derivatives impact, and future protocol risks.
Bitcoin ETF Outflows Explained
Understand Bitcoin ETF outflows, their impact on institutional flows, and what ETF redemptions mean for Bitcoin prices and market dynamics.